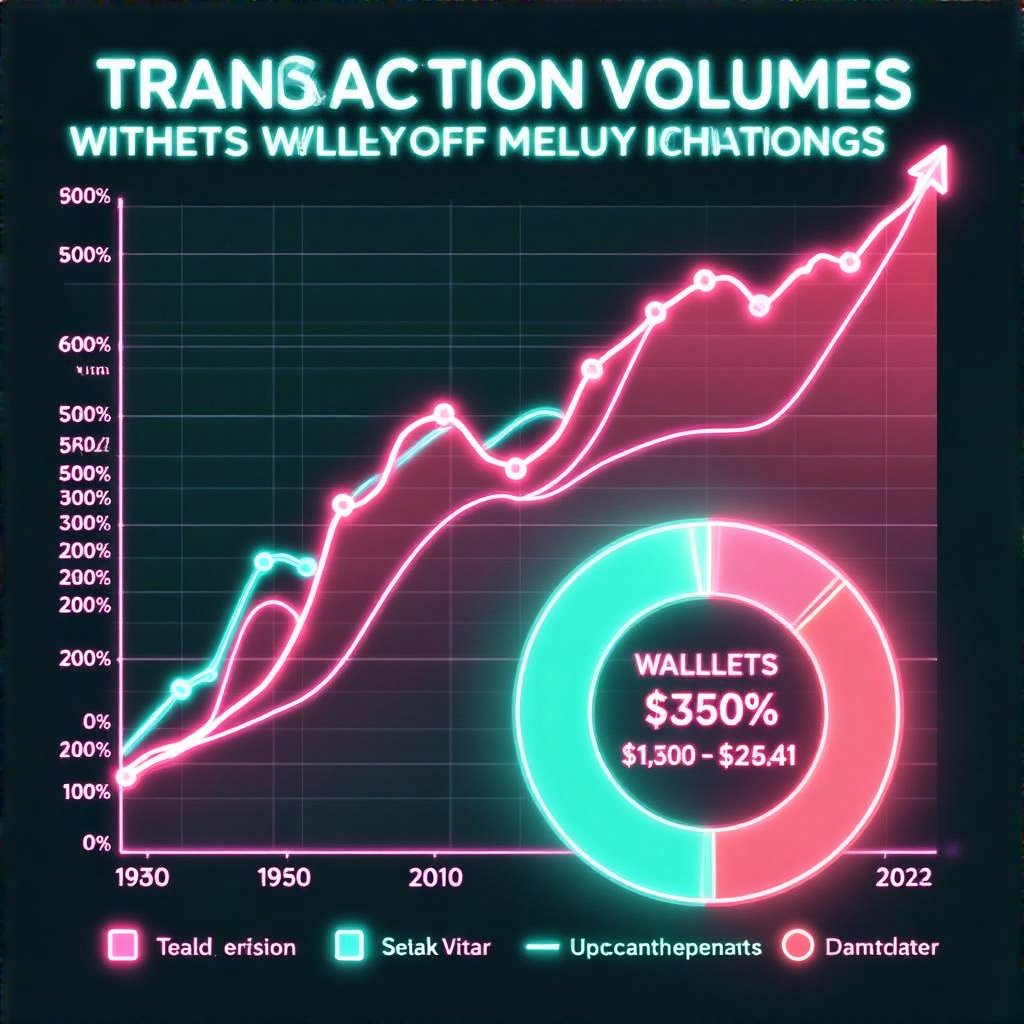
Unpacking the $ODWIF Transaction Flow: What Data Reveals

The on-chain transaction data of the Onedollarwifhat ($ODWIF) token on Binance Smart Chain (BSC) offers a critical window into the project's activity, health, and potential red flags. This detailed analysis applies the lens of blockchain forensics to expose underlying patterns and anomalies that may indicate strategic manipulations or project abandonment.
- Transaction Volume Trends
- Holder Distribution and Concentration
- Transfer Patterns & Anomalies
- Red Flags & Suspicious Activity
Transaction Volume Trends
By examining flow data, an initial insight reveals periods of heightened activity coinciding with marketing pushes or pump attempts. A significant volume spike typically indicates either organic community engagement or artificial trading strategies such as wash trading. The data shows that recent transaction volumes have diminished sharply, suggesting waning interest or potential project deactivation (source).

Holder Distribution and Concentration
Analyzing the wallet distribution highlights the extent of decentralization. A small cluster of wallets controlling a large share of tokens points to high centralization, raising questions about market manipulation. The top 10 wallets hold over 50% of the total supply, a red flag for potential pump-and-dump schemes or wash trading, especially if these wallets show rapid accumulation and disposal of tokens.
Transfer Patterns & Anomalies
Pattern analysis uncovers clusters of transfers between a limited set of addresses, sometimes involving timed bursts or hard-to-trace cycles. The presence of cyclic transfers or a high frequency of small-value transactions suggests attempts at volume inflation or masking true activity. These discrepancies between declared project intentions and actual transfer behaviors form the crux of forensic scrutiny.

Red Flags & Suspicious Activity
Multiple anomalies emerge from the on-chain data: sudden transaction surges, wallet address clustering, and inactive periods followed by abrupt activity spikes. These are typical indicators of potential wash trading, spoofing, or wallet hoarding. Close examination suggests that the project’s apparent decline might be engineered or at minimum, warrants caution pertaining to transparency and ongoing activity. For an investor or forensic analyst, such patterns underscore the importance of routine transaction data examination to flag emerging risks.